
Medicaid reimbursement vs. the real cost of nursing home care: state examples, the OBBBA risk, and alternative payment models
|
Key takeaways
|
Medicaid pays for about two-thirds of nursing home care; in Pease Bell’s analysis of fiscal 2025 cost reports, it accounted for 66% of resident days at the average facility. Yet in most states, it pays less than the care costs. Operators call this the "Medicaid shortfall." The gap shapes staffing, closures, and even whether a facility accepts a hospital referral. In a January 2026 survey, nearly half of LeadingAge Pennsylvania’s members said they had declined hospital admissions in the previous 90 days. Weak demand does not appear to be the reason. NIC MAP, the data service of the National Investment Center for Seniors Housing & Care, reports that occupancy at freestanding nursing care communities in its 99 largest markets reached 86.7% in early 2026. That is the highest level since 2016, even as the number of beds keeps shrinking. The federal One Big Beautiful Bill Act (OBBBA) now puts that gap at risk of widening.
How big is the gap?
The best neutral benchmark is a 2024 study by HHS’s Office of the Assistant Secretary for Planning and Evaluation (ASPE). It used payment data and cost reports from 44 states for July 2018 to June 2019 (referred to below as 2019 data). It found that Medicaid covered about 82 cents of every dollar the average or median nursing home reported spending on its Medicaid residents. Roughly 40% of facilities had 80% or less of their Medicaid costs covered, and only 8% were paid more than their costs. ASPE used statutory rates, which can miss supplemental payments. In one state studied by the Medicaid and CHIP Payment and Access Commission (MACPAC), those payments lifted coverage from 82% of costs to 139%.
The gap is not spread evenly. Nonprofit homes had the lowest payment-to-cost ratio of any ownership type, and homes staffing above 4.0 nursing hours per resident day had the lowest of any staffing group (Figure 1). In other words, the facilities investing most in staffing recover the smallest share of their Medicaid costs.
These figures predate the pandemic’s wage inflation and staffing crisis, and more recent state data suggest the gap has grown since.
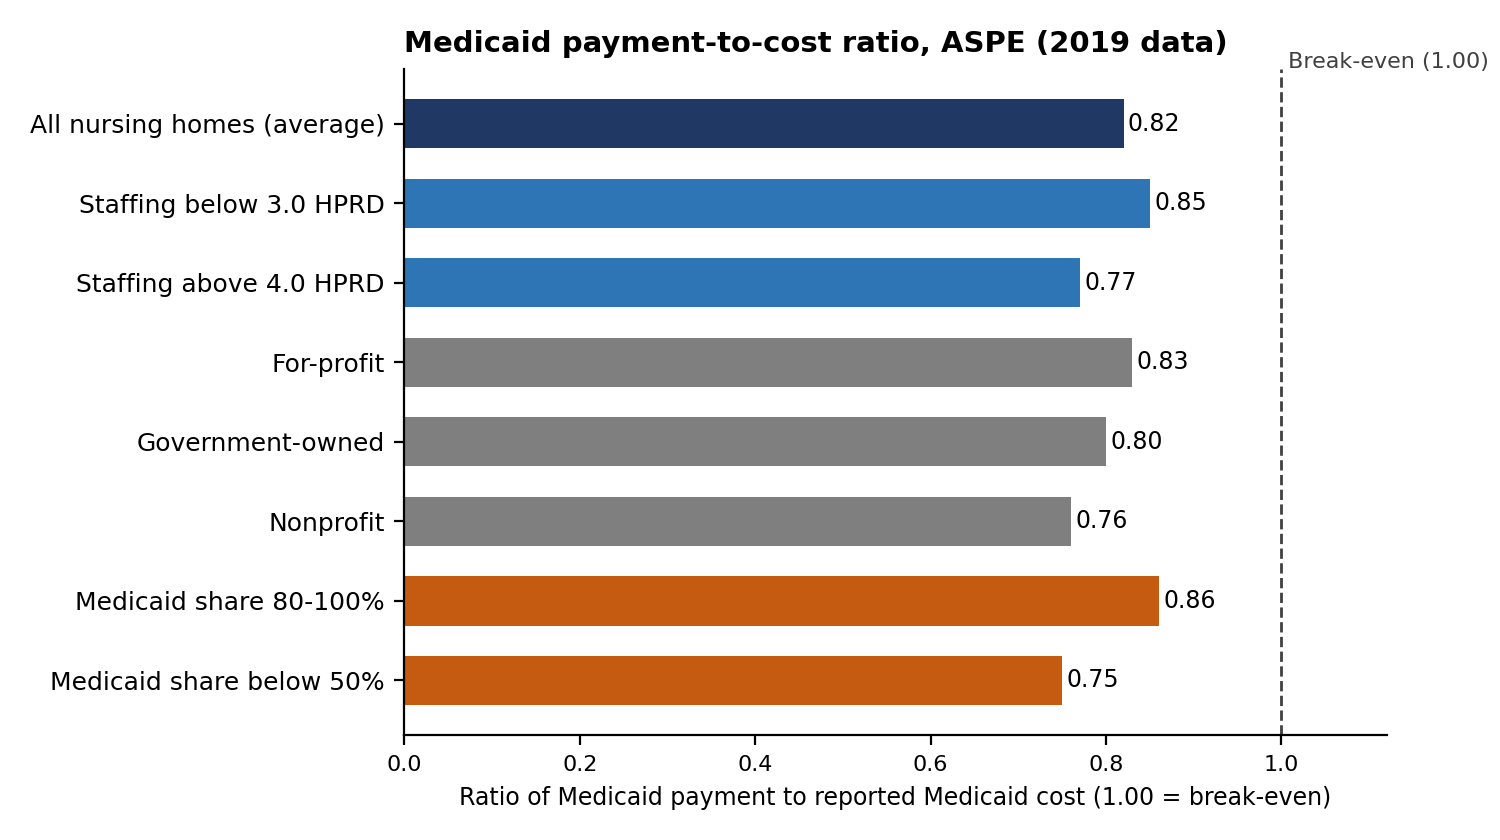
Figure 1. Medicaid payment-to-cost ratios by staffing level, ownership, and Medicaid share. Source: ASPE, 2024 (July 2018 to June 2019 data).
The gap varies widely by state
ASPE’s state-level results (Appendix Table 7 of its report) show mean Medicaid payment-to-cost ratios ranging from 0.46 in Nevada to 1.10 in Delaware. Only Delaware and Rhode Island had mean ratios above 1.00. Nevada, New Hampshire, Wisconsin, Illinois, and Pennsylvania covered the smallest shares of reported costs. In all, 15 of the 44 states had mean ratios below 0.80 (Figure 2).
A high payment rate does not guarantee a small gap. Louisiana’s average Medicaid rate of $180 a day covered nearly all of its facilities’ $183 average cost, while New York’s $246 rate covered only about 80% of a $314 average cost. What matters is how rates keep pace with each state’s own costs.
Why the gap exists
Medicaid was never designed to reimburse every dollar a facility spends. States limit allowable costs and cap each cost center, often at a percentage of a peer-group median. The federal requirement that rates be reasonable and adequate (the Boren amendment) was repealed in 1997. States now need only follow a public process and keep payments consistent with broad goals of efficiency, economy, quality, and access.
Rate adequacy therefore depends on state budgets, and facilities cover the shortfall from other payers: counting all revenue, ASPE found the average facility roughly broke even. High-Medicaid homes had better ratios, largely because their costs and staffing are lower. But they have the least other revenue to absorb what gap remains.
That cushion is also getting thinner. Traditional Medicare pays well; the Medicare Payment Advisory Commission (MedPAC) reports that the fee-for-service Medicare margin for freestanding skilled nursing facilities was 24% in 2024. But Medicare Advantage now covers 55% of eligible beneficiaries (KFF), and the Congressional Budget Office (CBO) projects 63% by 2034. Those plans pay less: in NIC MAP’s July 2023 data, $492 per patient day versus $589 for traditional Medicare. Medicare Advantage plans also authorize shorter stays. Pease Bell’s analysis of fiscal 2025 cost reports for more than 9,600 skilled nursing facilities found that their stays averaged about 28 days, versus about 44 for traditional Medicare.
As the Medicare subsidy shrinks, more of the burden falls on private-pay residents. NIC MAP reports that private-pay daily rates in its 99 largest markets rose 5.9% in the year to early 2026, the fastest growth it has recorded since 2016. In Florida, the state estimates the average private-pay rate at about $354 a day, against an average Medicaid rate of about $303. But in Pease Bell’s analysis, private-pay and other non-Medicare, non-Medicaid residents made up only about 18% of resident days at the average facility. They cannot absorb the gap indefinitely.
State examples
The examples below show four different ways the gap opens up. The figures come from different sources, years, and methods, so they illustrate the problem rather than rank states against each other.
|
State |
ASPE ratio (2019) |
Recent reported gap or pressure point |
Source and basis |
|---|---|---|---|
|
Pennsylvania |
0.70 |
$86.26 per resident day statewide; BAF of 80% in Q1 2026 cost about $63/day |
RKL for LeadingAge PA (2022 analysis); LeadingAge PA testimony, April 2026 |
|
New York |
0.80 |
About $100 to $150 per resident day; upstate example of $236 paid vs. $331 cost |
NYSHFA and LeadingAge NY estimates, 2026; upstate operator, 2026 |
|
Ohio |
0.88 |
About $60/day loss per Medicaid resident; $875M settlement for past quality payment errors |
LeadingAge Ohio, 2026; HB 479 (June 2026) |
|
Florida |
0.86 |
Average rate of $302.92/day, down 1.4% year over year |
Florida Agency for Health Care Administration rates effective Oct. 1, 2026 |
Table 1. Selected state examples. ASPE ratios are mean Medicaid payment-to-cost ratios from 2019 data (U.S. average 0.82); recent figures are industry-reported and use varying methods and data years.
Pennsylvania: a budget lever that cuts rates
A 2022 RKL analysis for LeadingAge PA put the statewide Medicaid funding gap at $86.26 per resident day, a total shortfall of about $1.16 billion. A major driver is the Budget Adjustment Factor (BAF), which scales rates down to fit the amount appropriated. LeadingAge PA testified that the BAF stood at 80% in the first quarter of 2026, which it said cost providers $63 per day. The association also reports 37 closures and 4,300 lost certified beds since 2020.
Relief is coming. The 2026-27 budget sets an 86% BAF floor for two years starting January 1, 2027. Press reports put the added funding at about $162 million in state funds and $215 million in federal funds, though they differ on whether that covers one year or two. A floor brings predictability, but it still means rates are held below what the state’s own methodology calculates.
New York: a gap that has grown for nearly two decades
LeadingAge New York reports that between July 2007 and July 2025, nursing home costs rose 55% while Medicaid reimbursement rose less than 15%. Because Medicaid covers about 75% of the state’s nursing home residents, there is little private-pay revenue to absorb the loss. Industry estimates of the gap vary widely, from nearly $100 per resident day (the state’s for-profit trade association) to as much as $150 (LeadingAge New York). It also differs by region: one upstate operator reports average reimbursement of $236 per day against an average cost of $331, while downstate facilities are generally reported to be paid more.
New York is also an early example of OBBBA exposure. Under a rule from the Centers for Medicare & Medicaid Services (CMS) implementing the law’s provider tax provisions, the state’s managed care organization tax has a transition period that ends December 31, 2026. That tax helps finance recent nursing home investments. Funding beyond that date is uncertain.
Ohio: when the formula itself is wrong
In September 2025, in State ex rel. LeadingAge Ohio v. Ohio Dept. of Medicaid, the Ohio Supreme Court unanimously ruled that the state had used the wrong formula for nursing home quality incentive payments, underpaying facilities by hundreds of millions of dollars. State law directed 60% of the increase from rebasing into the pool and based that increase on each facility’s rate for direct care costs. The department instead used the change in the price, a figure measured before case-mix adjustment. That produced a much smaller pool, and therefore a lower value per quality point, than the legislature had required.
The legislature fixed the statute going forward (House Bill 184, effective March 20, 2026) and, in House Bill 479 in late June 2026, appropriated $875 million to fully settle the court’s decision. Accepting a settlement payment waives further claims, so Ohio operators should check their figures first; Pease Bell’s Ohio articles cover the payment terms in detail.
The settlement covers the past, not the forward-looking gap. LeadingAge Ohio says that without quality payments funded at the level set in the 2022-23 budget, Ohio facilities lose about $60 per day on average for every Medicaid resident. LeadingAge Ohio has also warned that OBBBA’s financing changes will make the situation considerably more complicated, and said it expects the state to lose billions a year.
Florida: base components rise but net rates fall
The state’s average Medicaid rate effective October 1, 2026 is $302.92 per resident day, down from $307.37 a year earlier, a decline of about 1.4%. Several base components increased, but the statewide budget neutrality factor rose from about 13.16% to 17.45%, and the value of each quality point fell to roughly $1.454. Meanwhile, the nursing facility market basket CMS used for fiscal 2027 rose 3.3%. Against that, a flat or falling rate amounts to a real cut. Florida’s budget neutrality offset works much like Pennsylvania’s BAF: it lets a state hold spending to a fixed appropriation without formally cutting rates.
The OBBBA threat: why the gap could get wider
OBBBA, signed July 4, 2025, could widen the gap. The Congressional Budget Office estimates the law will cut about $911 billion from federal Medicaid spending through 2034. Nursing homes were spared some provisions, but the law works against them in four ways.
|
Date |
OBBBA provision relevant to nursing homes |
|---|---|
|
July 4, 2025 (baseline); Oct. 1, 2026 (in effect) |
Nationwide freeze: no new provider taxes and no increases to existing ones. Taxes enacted and imposed as of July 4, 2025 are grandfathered; the new limits apply from Oct. 1, 2026 (federal fiscal year 2027) |
|
Jan. 1, 2027 |
For applications filed on or after this date, retroactive coverage for traditional enrollees (including nursing home residents) drops from three months to two |
|
Oct. 1, 2027 (federal fiscal year 2028) |
Provider tax safe harbor in expansion states begins falling from 6% toward 3.5% for most provider types; nursing home taxes are exempt |
|
Jan. 1, 2028 |
State-directed payments above the cap (100% of Medicare in expansion states, 110% in non-expansion states) must step down at least 10 points per year |
|
Through Sept. 30, 2034 |
Federal minimum staffing rule cannot be enforced (CMS has also repealed its numeric minimums) |
Table 2. Key OBBBA dates for nursing facility finance.
1. It locks in the main tool states use to raise rates. States have long funded rate increases through provider taxes that draw federal matching funds. OBBBA bars new provider taxes and increases to existing ones. The new limits took effect October 1, 2026, and are measured against taxes that were enacted and imposed as of July 4, 2025. CMS’s July 2026 proposed rule implementing them (CMS-2452-P) leaves the thresholds for nursing home taxes unchanged. Nursing homes are exempt from the expansion-state phase-down, but not from the freeze. A tax frozen at its current rate leaves little room for new rate increases beyond what growth in the tax base provides. Meanwhile, wages, insurance, and other costs keep rising.
2. It caps and reduces supplemental payments. In many states, supplemental and directed payments help keep facilities afloat on top of below-cost base rates. OBBBA caps state-directed payments for nursing facility services at 100% of the Medicare rate in expansion states and 110% in non-expansion states. Grandfathered arrangements keep their legacy amounts through 2027, then must be cut by at least 10 percentage points a year starting January 1, 2028. Directed payments exist only in Medicaid managed care, so the cap is relevant in managed care states such as Pennsylvania, Texas, and Florida. Its effect depends on whether a state’s arrangements pay more than the Medicare benchmark. Medicaid nursing facility payments generally run well below Medicare (NIC MAP’s July 2023 data put Medicaid at $278 per patient day), so many arrangements may fall under the cap. Operators should confirm their own state’s position rather than assume either a cut or no change. For facilities above the caps, supplemental revenue will decline year after year even if base rates don’t change.
3. It puts pressure on the state budgets that set base rates. The largest risk may be indirect. Even with the nursing home exemption, states lose financing capacity elsewhere. RAND estimates the provider tax provisions will reduce total state budgets by about $278 billion from 2025 to 2034, with more than half from California’s managed care tax alone. Medicaid already dominates state budgets. According to KFF’s analysis of data from the National Association of State Budget Officers, it accounted for 31% of total state spending in fiscal 2025, counting federal funds. It also accounted for 17% of spending from states’ own funds, the pool that must pay for nursing home rate increases. Likely responses include freezing rate increases, delaying rebasing, shrinking supplemental pools, limiting directed payment programs, or raising provider assessments.
4. It increases the risk of resident days that are never paid. For applications filed on or after January 1, 2027, retroactive coverage for nursing home residents shrinks from three months before the month of application to two (often described as 90 days to 60). Long-term care Medicaid applications often take weeks or months to assemble because of asset and income documentation, so more days of care will fall outside the window. Consider a resident admitted on March 1 whose application is filed in June. Under the current rule, March, April, and May can all be covered. Under the new rule, March is not. At Florida’s average Medicaid rate of about $303 per day, those 31 days come to roughly $9,400 that may never be reimbursed, for a single resident.
What OBBBA does not change for residents. Work requirements and six-month eligibility checks apply to working-age expansion adults, not to older or disabled residents. One eligibility change does matter. Beginning January 1, 2028, the law caps the home equity limit for long-term care Medicaid at $1 million, with no inflation adjustment (homes on agriculturally zoned land are exempt). States can still set a lower limit, down to the indexed federal minimum. The immediate effect falls on the roughly dozen states, plus the District of Columbia, that now use a higher limit. Facilities should screen for it at admission.
What OBBBA does not fix. The law blocks the federal minimum staffing rule through September 30, 2034, and CMS repealed its numeric minimums effective February 2, 2026. That avoids a large unfunded cost, but it is not new money.
Supporters of the law, including CMS, argue that some provider tax arrangements shifted the state’s share of Medicaid costs onto federal taxpayers, and that limiting them restores a balanced federal-state partnership. CMS points to MACPAC analysis estimating that non-general-revenue financing has shifted about 5.4% of costs toward the federal government. Either way, the tools that have partly covered the shortfall are being frozen or cut while the shortfall remains.
Alternative reimbursement models that could help
No payment model creates money a state hasn’t appropriated. But design matters: some models track costs more closely, make rates more predictable, or bring in revenue from outside Medicaid.
Other models: cost-based and acuity-based rates
Minnesota’s Value-Based Reimbursement system, in place since 2016, pays each facility’s actual care-related costs up to a limit tied to its quality score. That design targets the ASPE finding that well-staffed homes recover the least. An independent evaluation found that direct care spending jumped in 2016, but wage growth then returned to its prior pace, and it found no evidence that the quality incentives improved quality. The system also required significant state funding and relies on cost reports about two years old. Several states are also moving Medicaid case-mix systems toward Medicare’s Patient Driven Payment Model (PDPM), including Texas (September 2025), Minnesota (from October 2025), and Ohio (phased in from January 2026 to July 2027). PDPM can direct more money to facilities with complex residents, but it mostly redistributes money rather than adding to it. Ohio’s provider association estimated that about half of facilities would gain and half would lose. Accurate coding of resident assessments now drives more of the rate.
Regular rebasing and automatic inflation indexing
In many states, a large part of the gap comes from rates that are not updated, not only from flawed methods. New York’s experience, with costs up 55% and reimbursement up less than 15% over 18 years, illustrates what can happen when rebasing and inflation adjustments are skipped. Committing to rebase on a fixed schedule and index rates to a recognized market basket in between keeps the gap from compounding.
Quality incentive pools
Ohio, Florida, Texas (through its Quality Incentive Payment Program), and other states pay part of the rate based on quality measures. This year showed their limits. In Ohio, it was the state’s formula for calculating quality payments, not facility performance, that ended up before the state Supreme Court. In Florida, average quality scores rose slightly this year, yet lower quality incentive payments and a larger budget neutrality offset still pulled average rates down. A quality program only helps close the gap if the pool is funded with new money and its value is protected from budget offsets.
Wage pass-through and direct care spending requirements
As of MACPAC’s 2022 review, 11 states required facilities to spend a set portion of the Medicaid rate on staffing. MACPAC notes that prior research associates these wage pass-through policies with higher staffing regardless of a state’s payment level. Texas now requires nursing facilities to spend at least 80% of the patient-care portion of Medicaid reimbursement on direct care. Facilities that fall short face recoupment unless they qualify for an exemption, such as strong quality ratings. Pennsylvania requires facilities to devote 70% of expenses to resident care, though the Philadelphia Inquirer reports that the 2026-27 budget made that easier to meet. New York has its own minimum spending requirements. These requirements don’t add money by themselves, but they make rate increases easier to justify politically, because legislators can see that new dollars go to care. Federal reporting adds visibility: CMS kept the 2024 requirement that states report how much nursing facility payment goes to direct care and support staff compensation.
Institutional Special Needs Plans and Medicare value-based arrangements
Another opportunity, for operators with the scale to pursue it, sits outside Medicaid. Under traditional Medicare fee-for-service, a nursing home that invests in on-site clinical care to prevent hospitalizations bears the cost while Medicare keeps the savings. Institutional Special Needs Plans (I-SNPs), Medicare Advantage plans limited to long-stay residents, let facilities share in those savings. The market is still small. Milliman counts 156 I-SNPs nationwide in 2026, fewer than in 2023, and no new sponsoring organizations have entered since then, even though enrollment keeps growing. MedPAC estimates that about 12% of long-stay nursing home residents are enrolled and describes I-SNP penetration as low, and Medicare advocates have raised concerns about whether these plans deliver the promised care. For operators with the scale and clinical infrastructure, though, I-SNPs offer a revenue stream that does not depend on state Medicaid budgets.
Operator steps, whatever model your state uses
Several actions help regardless of how rates are set. Keep Medicaid cost reports accurate and well documented, since they set the cost basis for rates and support rate appeals. Separately, confirm with your state or managed care plans how any grandfathered directed payment arrangement is calculated and distributed among facilities. Tighten Medicaid application timelines now, starting at admission, before the shorter retroactive coverage window takes effect in January 2027. Model the post-2027 step-down in directed payments and build it into long-range budgets. And engage with your state association before the next budget cycle, since key decisions are being made in 2026 and 2027.
The other side of the debate
Not everyone agrees the shortfall is as large as industry figures suggest. Most of the state numbers in this article come from provider associations, and their methods, data years, and definitions of "allowable cost" vary. ASPE notes that consumer advocates argue nursing homes are already adequately paid and that profit incentives can pull money away from care and staffing. In New York, the attorney general alleged that the owners of four Centers Health Care homes diverted more than $83 million through related-party rent, loans, and fees. The owners denied the allegations, and the case settled in 2024 for $45 million, most of it directed to resident care and staffing. Related-party transactions, real estate arrangements, and management fees all affect reported costs, and ASPE’s study did not judge whether facilities were operating efficiently. These concerns are one reason spending requirements and greater transparency often come attached to rate increases.
The bottom line
Whatever the exact number, the evidence consistently shows that Medicaid pays below cost for most nursing homes. The gap is widest at well-staffed and nonprofit homes, and it is hardest to absorb where Medicaid census is high and there is little other revenue to cover it.
OBBBA makes the gap likely to widen unless states backfill it. Better payment design can soften the impact but cannot replace adequate funding. Operators should know their state’s mechanics, protect their cost report and directed payment positions, tighten Medicaid applications, and model the years ahead.
Appendix: Medicaid payment-to-cost ratio by state
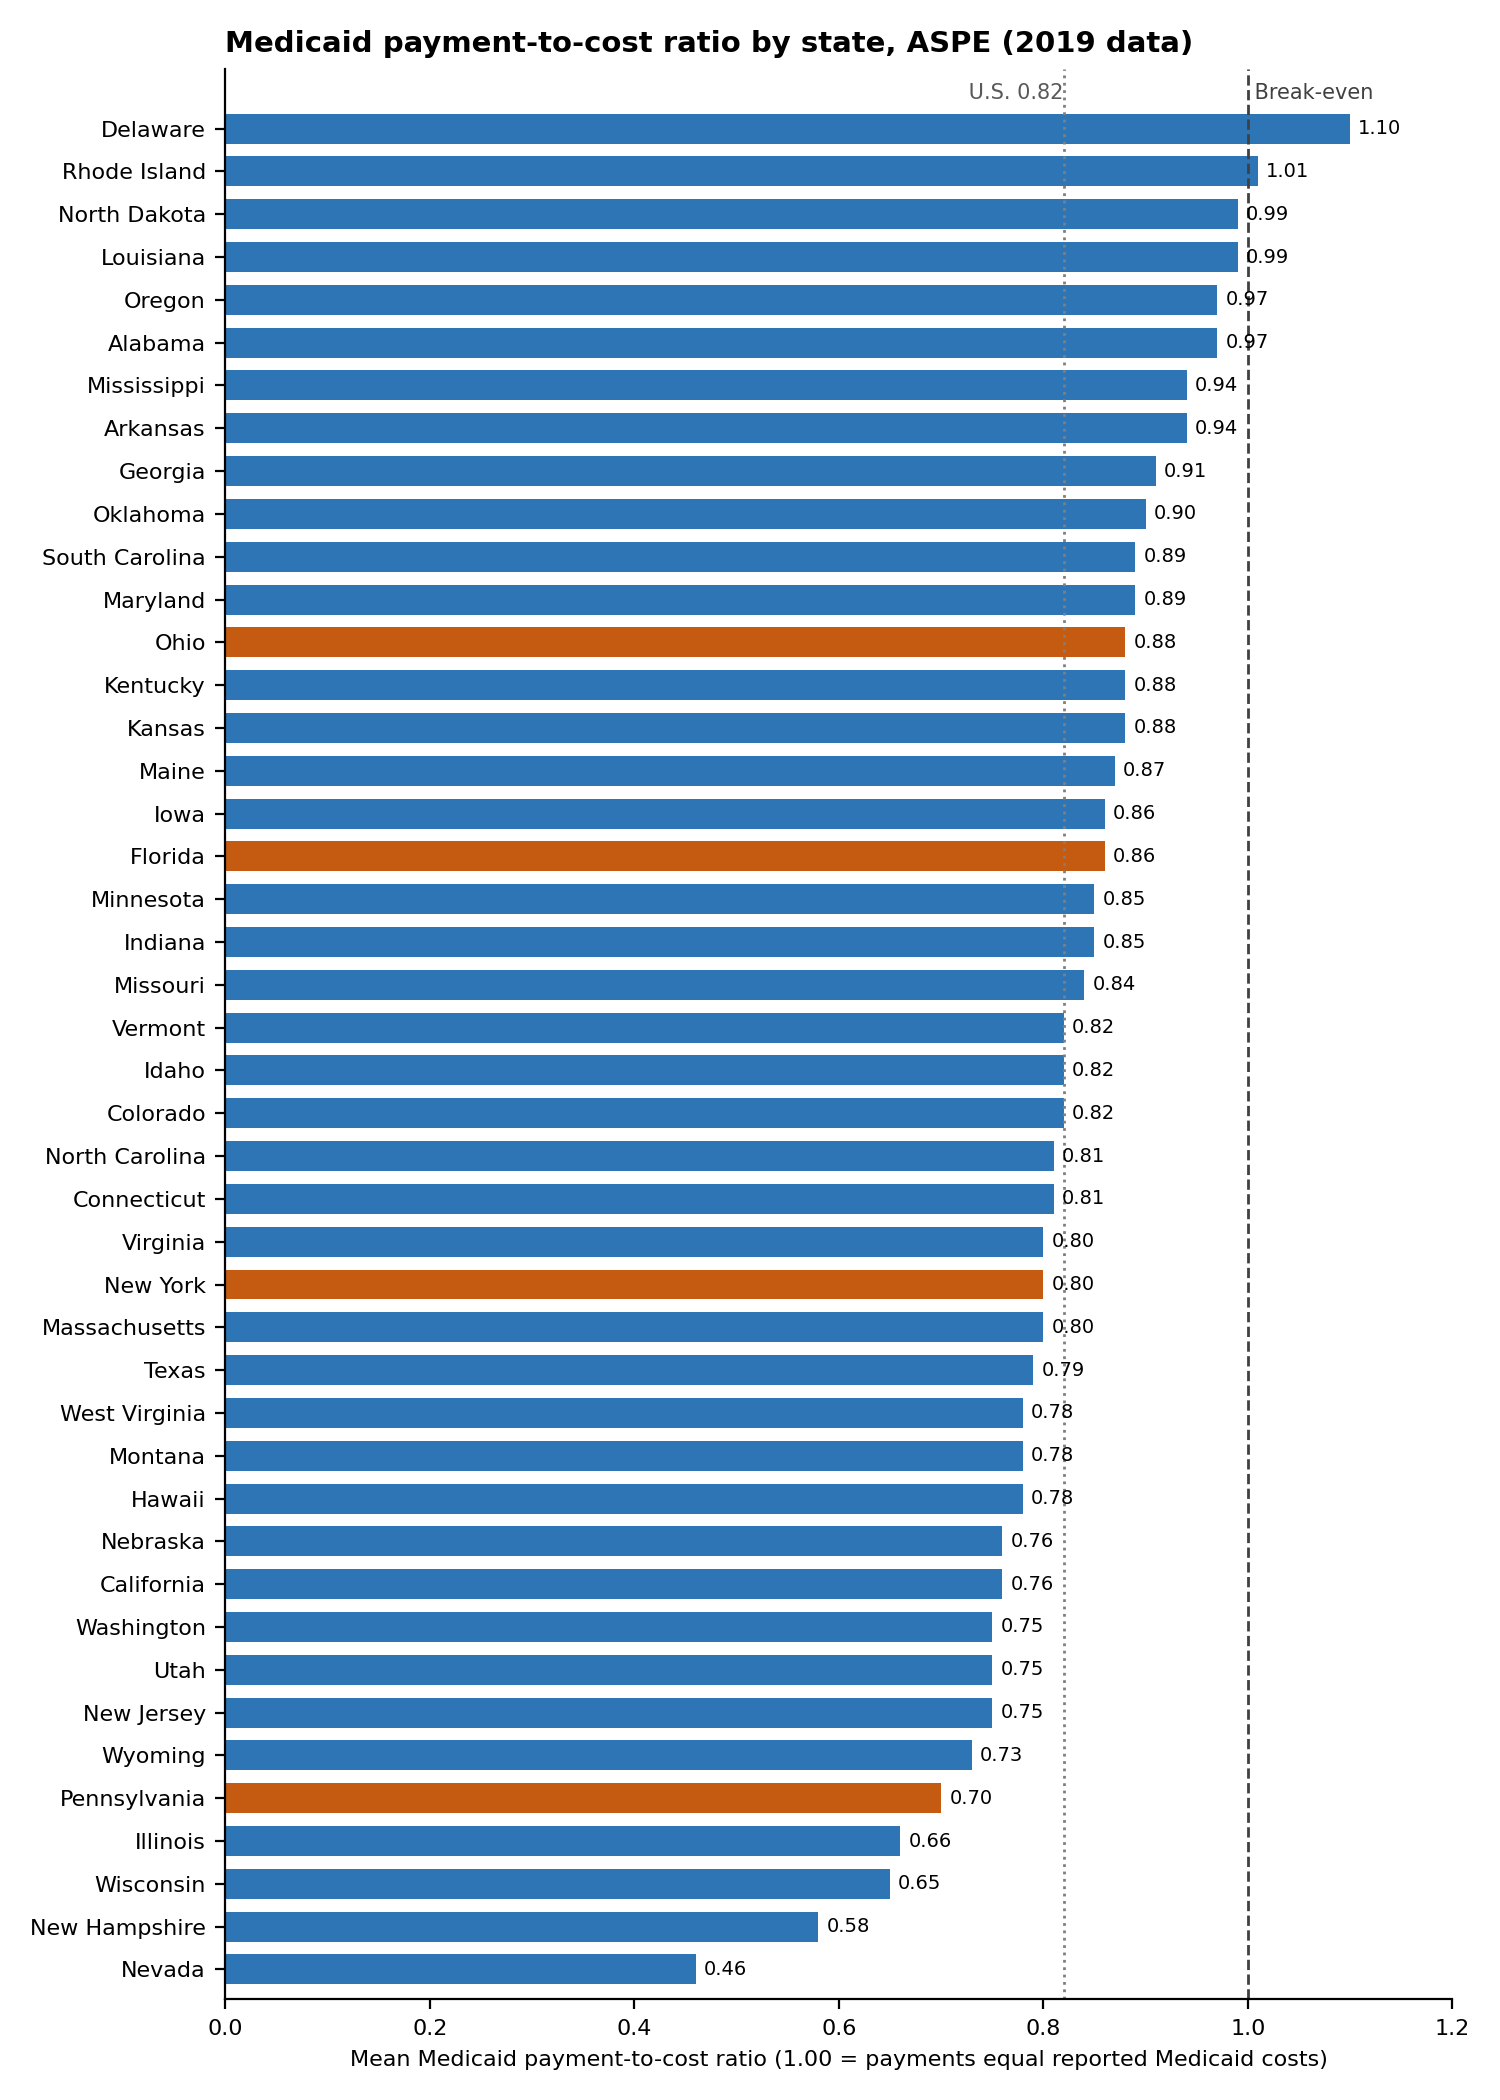
Figure 2. Mean Medicaid payment-to-cost ratio for freestanding nursing homes by state, 2019 data. Pennsylvania, New York, Ohio, and Florida are highlighted. Alaska, Arizona, Michigan, New Mexico, South Dakota, and Tennessee were not included. Source: ASPE, Assessing Medicaid Payment Rates and Costs of Caring for the Medicaid Population Residing in Nursing Homes: Final Report, October 2024, Appendix Table 7.
This article is for general informational purposes only and is not legal, tax, or financial advice. Figures are drawn from the public sources listed below, which use different methods and time periods; reimbursement rules change frequently, so consult a qualified advisor before acting on this information.
Sources
- ASPE, "Assessing Medicaid Payment Rates and Costs of Caring for the Medicaid Population Residing in Nursing Homes: Final Report," Oct. 2024, including Appendix Table 7 (state results). https://aspe.hhs.gov/reports/assessing-medicaid-payments-costs-nursing-homes
- MACPAC, "Estimates of Medicaid Nursing Facility Payments Relative to Costs," Jan. 2023. https://www.macpac.gov/wp-content/uploads/2023/01/Estimates-of-Medicaid-Nursing-Facility-Payments-Relative-to-Costs-1-6-23.pdf
- Urban Institute, "Repeal of the Boren Amendment." https://www.urban.org/research/publication/repeal-boren-amendment
- MedPAC, March 2026 Report to the Congress, Ch. 7 (Skilled nursing facility services). https://www.medpac.gov/wp-content/uploads/2026/03/Mar26_Ch7_MedPAC_Report_To_Congress_SEC.pdf
- Pease Bell analysis of fiscal year 2025 SNF cost reports (Form CMS-2540-24) already processed and released by CMS in its HCRIS database, 9,615 benchmarked facilities after data-quality screening; figures are simple averages of facility values with outlier trimming.
- KFF, "Medicare Advantage in 2026: Enrollment Update and Key Trends," 2026. https://www.kff.org/medicare/medicare-advantage-in-2026-enrollment-update-and-key-trends/
- NIC MAP, "Skilled Nursing Occupancy Held Steady in July" (July 2023 data). https://www.nic.org/blog/skilled-nursing-occupancy-held-steady-in-july/
- NIC, "A Closer Look at Freestanding Nursing Care Communities" (Yitao Luo), July 20, 2026, NIC MAP first-quarter 2026 data for 5,461 freestanding nursing care communities in 99 markets. https://www.nic.org/blog/a-closer-look-at-freestanding-nursing-care-communities/
- RKL LLP for LeadingAge PA, "Pennsylvania Medicaid Funding Shortfall for Nursing Facilities." https://www.leadingagepa.org/docs/default-source/advocacy-policy/rkl’s-pa-medicaid-funding-gap-analysis-report-for-leadingage-pa.pdf
- Lehigh Valley Business, "LeadingAge PA reports on crisis in aging services," May 2026. https://lvb.com/leadingage-pa-crisis-pennsylvania-aging-services/
- LeadingAge PA, 2026-27 nursing home budget brief (hospital admissions survey). https://www.leadingagepa.org/docs/default-source/advocacy-policy/lapa_nursinghomes_2026-27.pdf
- Pennsylvania Capital-Star, "Latest Pa. budget provides support for nursing homes, but work remains," July 2026. https://penncapital-star.com/health-care/latest-pa-budget-provides-support-for-nursing-homes-but-work-remains/
- Philadelphia Inquirer, Pennsylvania budget and nursing homes, July 20, 2026. https://www.inquirer.com/health/pennsylvania-budget-2027-nursing-homes-20260720.html
- McKnight’s Long-Term Care News, Pennsylvania closures survey, June 2026. https://www.mcknights.com/news/survey-reveals-new-access-concerns/
- LeadingAge New York release, May 27, 2026. https://www.leadingageny.org/linkservid/3238D5EA-3F20-4E4C-AFF9C4B5001D6CD4/showmeta/0/
- News10, "New York nursing homes rally for better Medicaid reimbursement," Mar. 2026. https://www.news10.com/capitol/nursing-home-medicaid-funding-crisis/
- Amsterdam News, "Nursing home funding gaps could impact NYS healthcare," Feb. 2026. https://amsterdamnews.com/news/2026/02/26/nursing-home-funding-gaps-could-impact-nys-healthcare/
- Oswego County Business, upstate New York Medicaid reimbursement, Apr. 2026. https://oswegocountybusiness.com/long-term-care-medicaid-reimbursement-for-nursing-homes-still-lagging-in-upstate-new-york/
- New York Attorney General, Centers Health Care settlement, Nov. 2024. https://ag.ny.gov/press-release/2024/attorney-general-james-secures-45-million-and-delivers-major-reforms-four
- Am. Sub. H.B. 479, 136th Ohio General Assembly (enrolled), Section 5. https://www.legislature.ohio.gov/legislation/136/hb479
- Ohio Capital Journal, Ohio Department of Medicaid court ruling coverage, Jan. 2026. https://ohiocapitaljournal.com/2026/01/29/ohio-department-of-medicaid-has-yet-to-pay-nursing-homes-up-to-1-billion-after-court-ruling/
- Pease Bell, "Ohio Medicaid Nursing Home Reimbursement: What Changed on July 1, 2026." https://www.peasebell.com/insights/ohio-medicaid-nursing-home-reimbursement-2026/
- Ohio Department of Medicaid, PDPM Transition Fact Sheet, Sept. 2025. https://dam.assets.ohio.gov/image/upload/medicaid.ohio.gov/Providers/ProviderTypes/LongTermCare/NursingFacility/PDPM_Fact_Sheet_for_Medicaid_website.pdf
- Pease Bell, "Florida Finalizes October 2026 Medicaid Nursing Home Rates," Sept. 2026. https://www.peasebell.com/insights/florida-medicaid-nursing-home-rates-october-2026/
- Pease Bell, "OBBBA Medicaid Cost Report Stakes: SDP Caps and SNF Cash Flow," June 2026. https://www.peasebell.com/insights/obbba-medicaid-sdp-caps/
- Pease Bell, "The One Big Beautiful Bill and Medicaid: What It Means for Nursing Homes." https://www.peasebell.com/insights/obbba-nursing-home-medicaid-reimbursement/
- KFF, "State Fiscal Conditions: Context on Medicaid Budgets for FY 2027," Sept. 2026 (NASBO data). https://www.kff.org/medicaid/state-fiscal-conditions-context-on-medicaid-budgets-for-fy-2027/
- RAND (Rao et al.), "State-Level Impacts of Key Medicaid Provisions in the One Big Beautiful Bill Act," RR-A4098-1-v2, updated June 2026 (press release Feb. 2026). https://www.rand.org/pubs/research_reports/RRA4098-1-v2.html
- CMS, "CMS Issues Guidance to Strengthen Oversight of Medicaid Financing." https://www.cms.gov/newsroom/press-releases/cms-issues-guidance-strengthen-oversight-medicaid-financing
- Georgetown CCF, "CMS Issues Final Rule Implementing H.R. 1’s Prohibition of Certain Uniformity Waiver Provider Taxes," Feb. 2026. https://ccf.georgetown.edu/2026/02/02/cms-issues-final-rule-implementing-h-r-1s-prohibition-of-certain-uniformity-waiver-provider-taxes/
- Minnesota DHS, VBR legislative report and evaluation. https://www.house.mn.gov/comm/docs/N-0VFcEHaEGFGjhOpXY64A.pdf
- Texas HHSC Information Letter No. 2026-03, Annual Patient Care Expense Ratio. https://pfd.hhs.texas.gov/sites/default/files/documents/il2026-03.pdf
- Milliman, "Medicare Advantage institutional special needs plans: 2026 market landscape," Mar. 2026. https://www.milliman.com/en/insight/medicare-advantage-institutional-special-needs-2026
- MedPAC, "Institutional special-needs plans: Provision of services, network-adequacy requirements, and star ratings," public meeting presentation, Apr. 10, 2026. https://www.medpac.gov/wp-content/uploads/2025/08/Tab-I-I-SNPs-April-2026.pdf
- Center for Medicare Advocacy, "The Premise and Reality of Institutional Special Needs Plans," Apr. 2026. https://medicareadvocacy.org/new-issue-brief-the-premise-and-reality-of-i-snps/
- KFF, "Medicaid Enrollment & Spending Growth: FY 2025 & 2026" (CBO estimate of $911 billion in federal Medicaid reductions), Dec. 2025. https://www.kff.org/medicaid/medicaid-enrollment-spending-growth-fy-2025-2026/
- CMS, "Amending the Indirect Hold Harmless Threshold of Health Care-Related Taxes Proposed Rule (CMS-2452-P)," fact sheet, July 2026. https://www.cms.gov/newsroom/fact-sheets/amending-indirect-hold-harmless-threshold-health-care-related-taxes-proposed-rule-cms-2452-p
- CMS, Center for Medicaid and CHIP Services Informational Bulletin on Public Law 119-21 eligibility provisions (Section 71108, home equity), Nov. 18, 2025. https://www.medicaid.gov/federal-policy-guidance/downloads/cib11182025.pdf
- Justice in Aging, "H.R. 1 Imposes New Limit on Home Equity for Medicaid Long-Term Services and Supports Effective 2028," 2026. https://justiceinaging.org/hr1-imposes-new-limit-on-home-equity-for-medicaid-ltss-effective-2028/
- Supreme Court of Ohio, State ex rel. LeadingAge Ohio v. Ohio Dept. of Medicaid, Slip Opinion No. 2025-Ohio-3066, Sept. 2, 2025. https://www.supremecourt.ohio.gov/rod/docs/pdf/0/2025/2025-ohio-3066.pdf
- LeadingAge Ohio, "CMS Finalizes 2.4% SNF Payment Update for Fiscal 2027," July 2026. https://leadingageohio.org/aws/LAO/page_template/show_detail/631701?model_name=news_article
- Florida Agency for Health Care Administration, "Florida Nursing Home Estimated Average Private Pay Rate 2026," Aug. 2026. https://ahca.myflorida.com/file/medicaid/2026%20Private%20Pay%20Report.pdf
- LeadingAge, "CMS Repeals Nursing Home Minimum Staffing Standards," Dec. 2025. https://leadingage.org/cms-repeals-nursing-home-minimum-staffing-standards/
- Pease Bell, "Ohio Nursing Facility Quality Point Reimbursement: Updated HB 479 Calculations," 2026. https://www.peasebell.com/insights/ohio-quality-point-reimbursement-hb479-update/